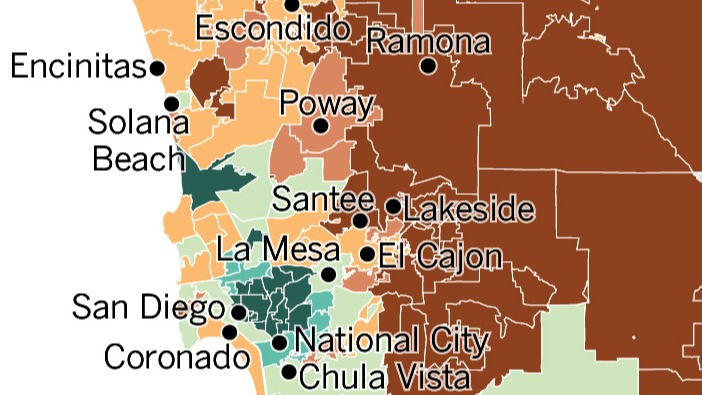
An analysis of San Diego County’s final general election results shows that competing local sales tax measures may have helped doom the countywide transportation tax measure in some cities — but not in the city of San Diego, where every neighborhood showed more support for the countywide tax hike than the city’s own.
San Diego neighborhoods tended to vote either against both the county and city tax measures or for both of them. And in most other cities that had a sales tax measure on the ballot, voters tended to support their local tax more than the countywide tax, the analysis of voting data by The San Diego Union-Tribune found.
Many of the San Diego neighborhoods that supported both tax increases by the widest margins also registered the strongest support for Kamala Harris, such as Hillcrest, Golden Hill and North Park.
Voter turnout was markedly lower this year than in the 2020 presidential election. It was lowest in southeast San Diego and South County.
Because San Diego County changed how it assigns voters to precincts between 2020 and 2024, the Union-Tribune did not compare this year’s election results by neighborhood to those from 2020.
How turnout compared
San Diego County voter turnout was much lower this year than during the last presidential election, even as tens of thousands more people were registered to vote this year than in 2020.
Only 75.8% of registered voters in San Diego County cast a ballot this year, compared to 83.5% in 2020. But San Diego County’s turnout was overall still higher than this year’s statewide average of 71.4%.
Only about 15% of San Diego County voters cast their ballots at the polls, while the rest returned them by mail.
There were significant geographic and demographic disparities in who turned out to vote. The neighborhoods where turnout was highest were largely wealthier coastal areas, while those with the lowest voter turnout were in southern San Diego and South County.

Southeastern San Diego had the lowest turnout in the county, with fewer than half of registered voters casting a ballot. Nearby Chollas Park also had one of the lowest voter turnout figures, at 54%, while City Heights, west Encanto and far East County’s Dulzura recorded turnout below 59%.
The South County communities of National City, Nestor, Lincoln Acres, Otay and San Ysidro all recorded turnout below 60%.
Meanwhile, northern University City and the community of De Luz near Fallbrook had the highest voter turnout — above 90%. Other communities with especially high turnout were mostly higher-income, coastal and Democratic-leaning areas, including La Playa in Point Loma, Hillcrest, Del Mar, Encinitas and Solana Beach.
How did Kamala Harris do?
Harris got significantly fewer votes from San Diego County than Joe Biden did four years ago. About 56.9% of county voters supported Harris while 40.1% voted for Donald Trump, compared to 60.2% who voted for Biden and 37.5% who voted for Trump in 2020.

The lower turnout cost Harris votes, compared with Biden in 2020. She won 841,372 votes from county voters, compared to 964,650 cast for Biden.
But Trump wasn’t hurt as much by lower turnout. He drew 593,270 county votes this year, compared to 600,094 four years ago.
Compared to voters statewide, San Diego County voters were less likely to vote for Harris and more likely to vote for Trump — about 58.5% of statewide voters cast ballots for Harris, and 38.3% did so for Trump.
The communities that showed the largest vote margins for Trump this year were in sparsely populated areas of rural East County, including Japatul, Ocotillo Wells, Descanso and Jamacha, as well as Alpine, parts of El Cajon and De Luz near Fallbrook.
Meanwhile, the communities that voted for Harris by the widest margins were primarily in central San Diego — including Hillcrest, North and South Park, Mission Hills and Golden Hill.
Did sales taxes hurt each other?
Sales tax measures made for some of the closest races in the county this election.
Those include Measure E, the one-cent San Diego increase that would have raised $400 million a year in general city revenue, and also Measure G, the half-cent countywide sales tax surcharge that would have raised money for transportation projects.
Both measures failed by thin margins, with 50.3% of city voters voting no on Measure E and 50.5% of county voters voting no on Measure G.

The neighborhoods that cast the strongest support for the citywide tax increase were a mix of higher- and lower-income neighborhoods in central and southeastern parts of the city. Those included southeastern San Diego, Golden Hill, Hillcrest, Chollas Park, North Park, City Heights, Encanto and Normal Heights.
That group includes neighborhoods that showed strong Democratic registration advantages, the strongest support for Harris and the county’s lowest voter turnout rates, including lower-income, southern neighborhoods with significant infrastructure needs.
Meanwhile, the neighborhoods most opposed to the city sales tax included a mix of coastal and inland communities that have a weaker Democratic registration advantage. Those included neighborhoods in Point Loma and in suburban northeastern San Diego, including San Pasqual, Rancho Peñasquitos, Rancho Bernardo and the Sabre Springs and Miramar Ranch area.
In the city of San Diego, more voters supported the countywide tax increase than their own local tax increase. About 51% of city voters voted for Measure G, but fewer than 50% backed Measure E.
And in every single city neighborhood, the margin of support for the countywide tax hike surpassed that of the city measure. Measure G got some of its strongest support in southeastern San Diego and in University City, an area served by the Blue Line trolley extension completed in 2021.
However, it doesn’t appear that competition between the two tax measures was a significant factor contributing to Measure E’s defeat in the city, because the vast majority of San Diego neighborhoods tended to either vote for both measures or against both measures.
Only in six areas did a majority of voters reject Measure E while supporting Measure G: Harbor, Midway/Old Town, Ocean Beach, Serra Mesa, Pacific Beach and Miramar.
And in no San Diego neighborhood where a majority of voters backed Measure E did they also reject Measure G.

But competition between tax measures may have had a bigger impact on results in some other cities, the results analysis suggests.
In most of the 10 cities in the county that had a local sales tax increase or extension on the ballot, the local tax measure commanded broader support than Measure G.
In four of the six cities where voters approved their local tax measure, they also voted down Measure G.
Only in San Diego and Encinitas did voters register more support for Measure G than for their local tax. In Encinitas and Santee, the majority of voters said no to both the local and countywide tax measures.
San Diego and Encinitas were two of five local cities that had asked voters this year to raise their local sales tax by a full cent. The others — Escondido, Lemon Grove and San Marcos — passed their full-cent increases.


