

Here’s one economic prediction I have complete confidence in: There will be fewer federal workers, as the second Trump administration slashes its way to a smaller bureaucracy.
Others can debate how the White House accomplishes that goal, the logic behind this mission, and what such a job culling means for governance and services. We’ll focus on what these job cuts could mean for the economy, especially in California.
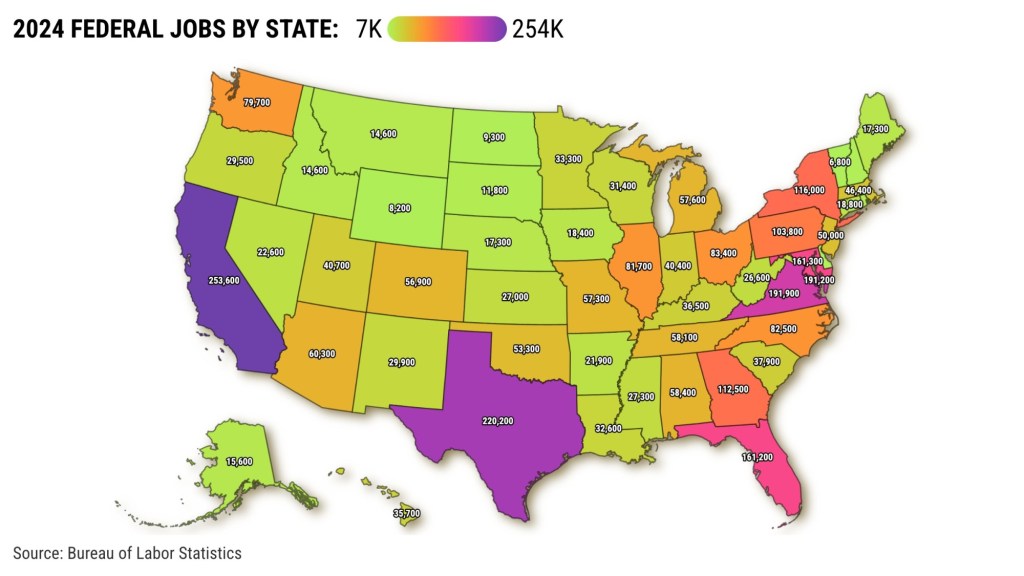
To see where Uncle Sam is a major employer, my trusty spreadsheet looked at job stats for the 50 states and the District of Columbia – using federal job counts, including defense workers, and overall employment numbers.
California, the nation’s largest job market, also ranks No. 1 for federal employment among the states with 253,600 U.S. government workers in 2024. That’s roughly the same size workforce as is found in the state’s real estate businesses, warehouses, or physicians’ offices.
After California comes Texas with 220,200 federal workers, Virginia with 191,900, the District of Columbia with 191,200, Maryland with 161,300, and Florida with 161,200. The fewest federal jobs are in Delaware (6,700), Vermont (6,800), Wyoming (8,200), New Hampshire (9,100), and North Dakota (9,300).
Now while California has significant numbers of federal jobs at risks, the U.S. government workforce is only 1.4% of all Golden State workers. That’s the 13th smallest slice among the states and well below federal workers’ 1.9% share nationwide.
The most significant shares – and the most prominent economic risk – surround the nation’s capitol. The U.S. employs 25% of workers in the District of Columbia, 5.8% in Maryland, and 4.5% in Virginia.
Federal workers are hardest to find in Wisconsin, just 1% of all jobs, then Connecticut, Minnesota, New Jersey and Iowa at 1.1%.
By the way, California’s economic rivals have modest shares, too. Federal jobs account for 1.6% of all workers in Texas and Florida.
Growth story ends
One economic shock will be the loss of Uncle Sam’s hiring mode.
The U.S. government added 166,200 jobs between pre-pandemic 2019 through last year. California had the ninth-largest increase, 5,400 positions or 3% of the nation’s federal job growth.
Florida had the most U.S. government hiring, up 18,300 workers over five years. Texas followed at 16,200, Maryland at 15,800, Virginia at 10,100, and Georgia at 9,200.
Conversely, there were two declines in federal jobs – D.C. was off 4,100 since 2019 and Vermont was down 300.
Now contemplate this hiring on a percentage-point basis.
California’s 2.2% five-year growth in federal jobs ranked No. 45 among the states and was far below the nation’s 5.9% federal staffing increase.
Federal jobs grew fastest in Delaware and Tennessee, up 16%, Nevada, up 15.6%, Florida, up 13%, and North Carolina, up 11%. Texas was No. 17 at 8%
The slowest federal hiring – minus cuts in D.C. and Vermont – were in North Dakota, up only 0.3% since 2019, New York at 0.9%, and Massachusetts at 1.7%.
Bottom line
There will be plenty of heartache among federal workers, in California and across the nation, as the bureaucracy gets a severe pruning.
It’s a sharp reversal as federal positions were 6% of all the jobs created in 2019-24.
But Uncle Sam’s 5,400 added staff in California since 2019 equaled only 0.9% of the 620,100 jobs added by all employers combined. Federal staffing had less influence in hiring in only six spots: New Jersey, D.C., Hawaii, Louisiana, Maryland, and North Dakota.
And the feds were just 1.2% of hiring in Texas since 2019 (No. 43) and 1.9% in Florida (No. 32).
Where might be the biggest economic anxieties?
Well, the U.S. government was 72% of West Virginia job growth since 2019, 17% of Vermont’s hires, 16% of Wyoming, 15% of Illinois, and 11% of Michigan.
Politically speaking
So are federal jobs a bigger slice of the economic pie in the states that supported Trump or elsewhere?
Like many political questions, there’s no simple answer.
Those “red” states had 1.56 million federal jobs last year, with 117,000 added since 2019. That’s 8% growth. “Blue” states had 1.43 million federal jobs after 49,200 were added in five years, a 4% bump.
In red states, U.S. hiring equaled 2% of 5.43 million jobs added overall in five years. In blue states, federal hires comprised 3% of the 1.63 million jobs added since 2019.
Jonathan Lansner is the business columnist for the Southern California News Group. He can be reached at jlansner@scng.com