
Which state economies are best at juggling the needs of bosses and workers alike?
In recent months, my trusty spreadsheet produced a pair of state economic rankings. One took the view from the employer’s perspective. The other saw economics through the employee’s eye.
Let’s politely say there were passionate responses to both scorecards, with California getting poor marks for business friendliness but high grades for worker benefits.
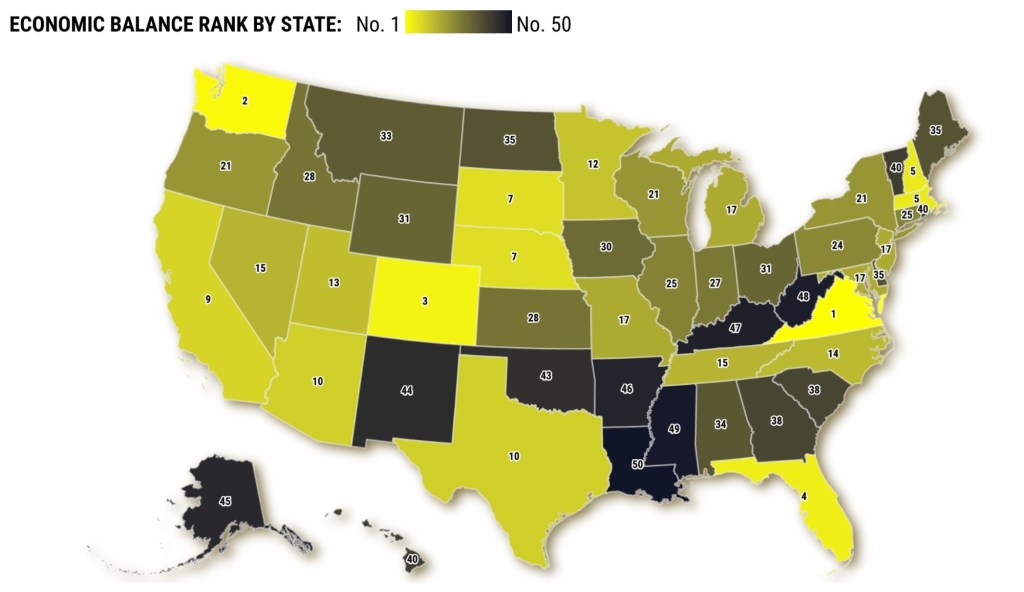
As an attempt to settle numerous debates, those rankings were combined to create a scorecard measuring what I’ll call the most “balanced” state economies.
This math shows California ranking No. 9 for reasonable management of the battle between boss and employee.
The best spot for this yardstick of economic symmetry was Virginia, followed by Washington state, Colorado, Florida, and Massachusetts, New Hampshire. Texas was No. 10.
Worst states? Louisiana, Mississippi, West Virginia, Kentucky and Arkansas.
How did we get here?
Let’s refresh our memories of those previous grades.
When it comes to business-leaning scores – compiled with stats tracking everything from taxes to regulation to growth – California ranked No. 30
Tops were North Carolina, Utah, Texas, Tennessee and Florida. The lowest were Hawaii, Louisiana, Alaska, New Mexico and Rhode Island.
As for employee-centric thinking, my rankings looked at variables such as wages, labor laws and layoffs. It scored California third-best.
The Golden State was topped by Massachusetts and Washington and was followed by New York and Connecticut. Meanwhile, the least worker-friendly states were Mississippi, Georgia, Louisiana, West Virginia and Idaho.
And this scorecard graded California’s major rivals Texas (No. 34) and Florida (No. 20).
Bottom line
This isn’t just comparing two samplings of business-related stats. The boss vs. worker scrum is a tussle that governments and corporations often struggle to manage.
How much leeway should bosses have in managing their staffs, their time and their workplaces? What’s the proper level of business fees and taxes? Or how much should government nudge up wages?
And in an age where growing worker productivity is essential, finding the right mix is critical and tricky.
So contemplate the balance scorecard results with a wider lens – states sliced into three groups according to their “balance” grades.
The highest-scoring states had the most workers, the fastest job creation since 2019, and the highest wages. Perhaps the middle ground in this debate is most appealing to the masses.
My balance ranking’s top third had 77 million workers as of September – roughly half the nation’s staffing. Typical earnings ran at a $60,400 annual pace. Those states added 5 million jobs in five years, or 7% growth.
Yet, the modest pay of low-score states may appeal to some bosses.
States at the bottom of the balance gradings had 23 million workers typically earning $55,000 yearly. These states added 1 million jobs in five years, or 4.6% growth.
Yes, that’s slower hiring. Yet it’s also job creation that outpaces the balance ranking’s center slice. Those states had 57 million workers making $57,000 yearly – with 1.1 million new jobs, but that’s only 2% growth.
Jonathan Lansner is the business columnist for the Southern California News Group. He can be reached at jlansner@scng.com
My most-read columns of 2024 …
Originally Published:


