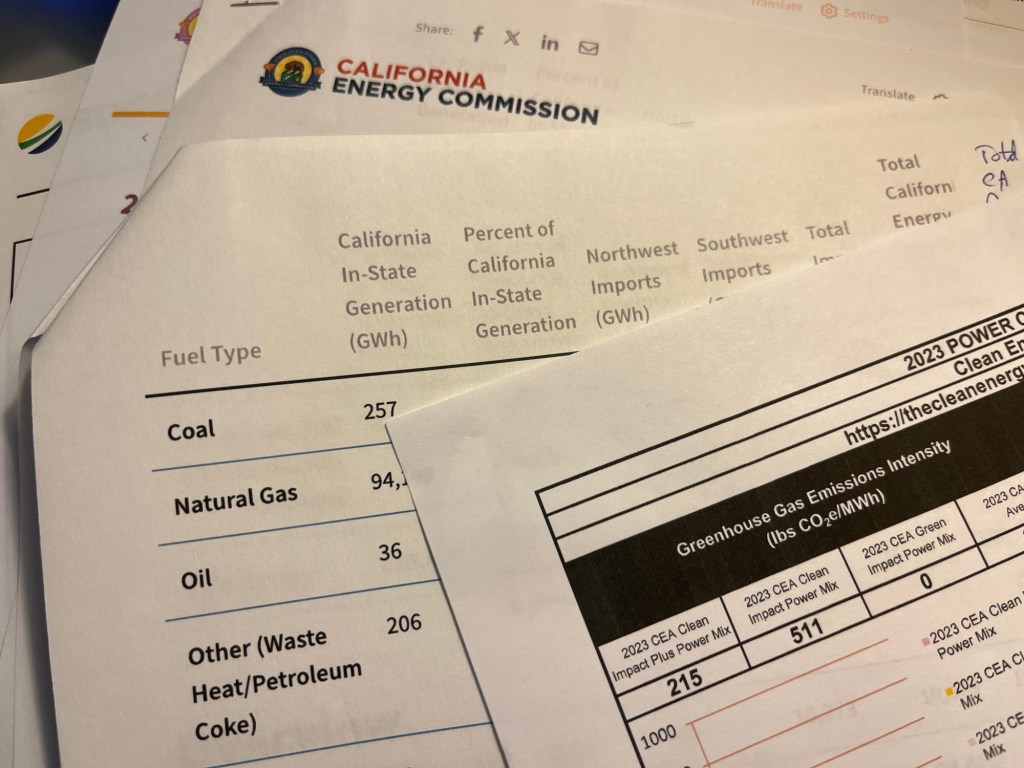
After crunching the numbers for 2023, data released by the California Energy Commission show the state’s power mix did not not change much from the year before — except for one source.
It was a boom year for hydroelectricity.
Cold and wet conditions in the first three months of 2023 led to deep snowpack levels that broke records in some portions of the Sierra Nevada. The Mammoth Pass in the central Sierra reported 104.5 inches of snow-water equivalent (the amount of water in the snowpack) on April 1, which was the highest value recorded in 93 years.
The subsequent runoff when the snow started to melt replenished reservoirs at hydro facilities such as the Shasta Powerplant, which produces hydroelectric power for the 15-state western power grid, and the Edward Hyatt Power Plant that is fed by the reservoir at the Oroville Dam in the Sierra Nevada foothills.

According to the energy commission, in-state electricity generation from large hydroelectric facilities in 2023 increased 85% compared to the year before and accounted for 12.55% of all generation.
It takes a while to track down the annual electric generation numbers from multiple generators, and the energy commission posted the figures for 2023 on Sept. 26 of this year.
State policymakers have set a goal to produce 100% of California’s electricity from carbon-free sources by 2045, if not sooner, but the single largest energy source in the power mix remains natural gas, which is a fossil fuel.
Natural gas accounted for 36.5% of California’s total power mix in 2023, which is virtually unchanged from the year before.
Solar made up 17% of the state’s electric generation, but the number does not include virtually all the photovoltaic systems that residents and small businesses have installed. That’s because only power plants that generate 1 megawatt of electricity or more are required to file data with the energy commission.
Since most rooftop solar systems generate less than that, they are typically classified as distributed generation, or “behind-the-meter.” There are 1.8 million such systems across the state, with a combined capacity of about 15,000 megawatts.
In a similar vein, the 2023 California power generation numbers do not include battery storage projects because batteries do not produce electricity but rather store it from other sources and then release the energy into the power grid later.
Batteries are booming in the Golden State.
In 2019, battery storage amounted to just 770 megawatts on the electric grid but as of September of this year, that number has grown to nearly 13,400 megawatts of capacity, according to the energy commission.
The power mix in San Diego
Looking at the numbers on the local level, the utility and community choice energy programs in the San Diego area provided their customers with a higher percentage of renewable power in 2023 than the state average.
Each year, San Diego Gas & Electric, San Diego Community Power and the Clean Energy Alliance are required — along with all other “load serving entities” across the state — to verify all the energy resources they use and then post their Power Content Labels.
Power sources that state officials categorize as “eligible renewable” made up 36.9% of California’s power mix in 2023. That includes wind, solar, biomass and bio-waste, geothermal and small hydroelectric plants.
San Diego Gas & Electric’s content label reports that 41.4% of its power mix came from those eligible renewable energy sources. Of that amount, utility-scale solar accounted for 22.6% and 18% came from wind farms.
San Diego Community Power and the Clean Energy Alliance are two of 25 community choice aggregators, or CCAs, that have sprung up around California in recent years to encourage the use of cleaner power sources.
Unlike conventional power companies like SDG&E, CCAs concentrate strictly on purchasing electricity generation for residents and businesses in their respective municipalities. Other responsibilities, such as transmission and distribution of power, maintaining poles and wires, and customer billing remain with the state’s incumbent utilities.
Both of the CCAs in the San Diego area offer plans in which customers can spend extra on their monthly bills to purchase power that pencils out to be 100% renewable and/or carbon-free. They also offer less expensive plans with renewable energy content at lower proportions.
!function(){“use strict”;window.addEventListener(“message”,(function(a){if(void 0!==a.data[“datawrapper-height”]){var e=document.querySelectorAll(“iframe”);for(var t in a.data[“datawrapper-height”])for(var r=0;r<e.length;r++)if(e[r].contentWindow===a.source){var i=a.data["datawrapper-height"][t]+"px";e[r].style.height=i}}}))}();
Community Power’s 2023 standard PowerOn service provided 51.1% of its content from eligible renewable sources — about 14 points higher than the state’s overall power mix. A little more than 27% of PowerOn’s content came from solar, while 15.3% came from wind.
“The team has been working very diligently” to comb through the numbers, Byron Vosburg, Community Power’s chief commercial officer, said during the group’s most recent public meeting on Nov. 21. “There have been times when we’ve been chasing down tens or hundreds of megawatt-hours here and there to make sure this is all trued-up and tied down.”
San Diego Community Power purchases power for more than 950,000 customer accounts in the cities of San Diego, Chula Vista, La Mesa, Encinitas, Imperial Beach, National City and the unincorporated areas of San Diego County. It’s the second-largest CCA in the state.
The Clean Energy Alliance serves more than 244,000 customer accounts in North County —Solana Beach, Carlsbad, Del Mar, Escondido, San Marcos, Oceanside and Vista.
In addition to its 100% option, CEA offers customers a program called Clean Impact that has at least 50% renewable content. It also offers its default Clean Impact Plus program that is 50% renewable and 75% carbon-free.
In its 2023 power content label, CEA reported that 47.6% of its Clean Impact Plus power mix comes from eligible renewable resources, which is almost 11 points higher than the state’s power mix. Of that 47.6%, utility-scale solar accounted for just over 26% and wind made up 21%.
CEA’s Clean Impact program reported renewable content of 45.9%, with all of it coming from utility-scale wind.
CEA and Community Power reported no natural gas in their content, while SDG&E had 58.4% of its power mix coming from gas.