

What will it take to get house hunters in a buying mood again?
My trusty spreadsheet examined a host of federal and industry real estate and economic stats from the past 50 years to help explain the incredibly low number of homes bought nationwide.
Consider that in 2023-24, Americans bought 9.5 million residences, combining existing houses and new homes. It’s the slowest sales pace since 1995 – when the economy was recovering from the early 1990s business challenges. The employment rate was 3.6% and mortgage rates 7.9%.
Recent sales are 21% below pre-pandemic 2019, or what some folks see as the good ol’ days. And they’re 7% below average transaction volumes since 1975.
Next, consider the latest purchasing pace against a growing national population. More people need more homes, no?
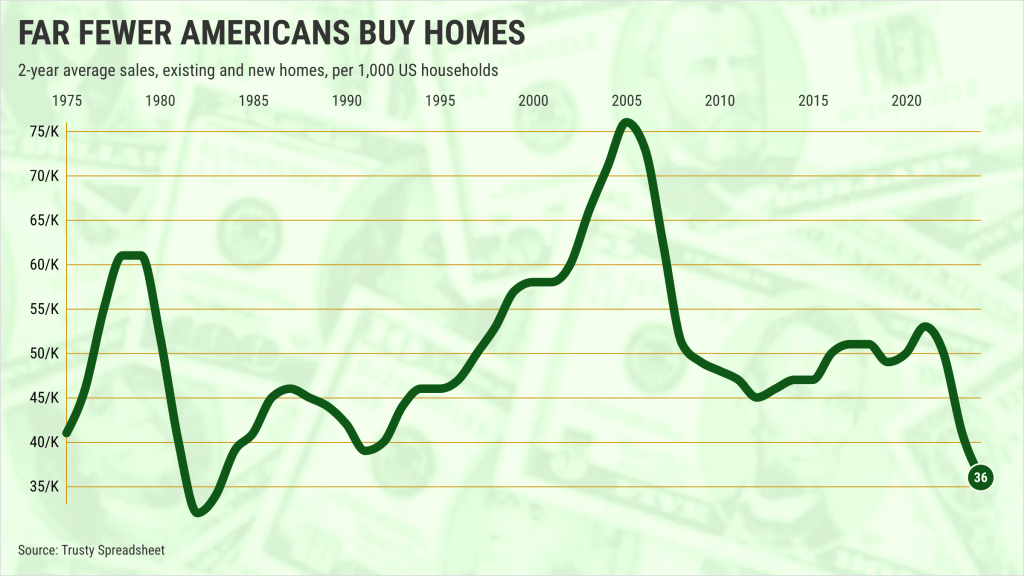
Well, recent sales equal 36 per 1,000 American households. That is the slowest rate since 1983. Yes, that’s 41 years ago, when we saw crazy days with 13.2% mortgages and 5.2% joblessness.
It’s also the third-lowest buying pace in 50 years, down 26% from 2019 and 27% below the 50-year average.
Pick a descriptive term for this real estate debacle: Flop? Plunge? Nosedive? Or crash?
Who can afford this?
House hunters are saying “No” to illogical pricing.
My tally of pricing for existing and new homes shows that U.S. buyers paid a record $415,800 nationwide during the past two years. (Note: The median selling price of an existing California existing single-family house was $841,000 in 2023-24.)
Prices nationwide are up a staggering 55% vs. 2019. Sadly, that’s not a house hunter’s only financial challenge.
Recent borrowers faced a 6.7% average 30-year mortgage rate – way up from 3.9% in 2019. By the way, mortgages have averaged 7.7% in the past half-century.
When combining these soaring prices and rates, theoretical house payments jump 111% in five years to $2,150 monthly, assuming a 20% downpayment. Yes, more than double.
Of course, paychecks didn’t keep up as the $80,000 median U.S. household income is up only 29% vs. 2019.
So a payment-to-paycheck yardstick now says homeownership equals 32% of income – up from 19% five years back or a 28% average burden of the last 50 years.
Not bad times
Exceptionally sluggish homebuying comes despite a decent job market. Remember, you need a solid paycheck to be a buyer.
U.S. unemployment ran 3.6% the last two years – far below the 6.2% average. And recent 4.7% typical pay raises are fatter than the 4.4% average gains since 1975.
That kind of economic strength kept homebuilders’ building, modestly.
New homes were 14% of all homes sales over the past two years. That’s the highest share since 2006 – dare I say, just before the previous housing crash.
Or look at it this way: 1.9 million permits were pulled to construct single-family homes in 2023-24. The pace is 13% faster than 2019, and on par with the 50-year average.
But those permits look lethargic on a per-capita yardstick. It equals 7.2 permits per 1,000 households. Yes, that’s up 5% vs. 2019, but it’s 23% below the 50-year pace.
Bottom line
There are zero simple ways to boost a house hunter’s odds of success.
Forget policy debates. Ponder instead the harsh math.
To get the current market back only to historically average affordability – 28% of income – mortgage rates must fall to 5.3%, household incomes must jump by 15%, or home prices need to drop 14%. Or some combination of this trio.
But ponder the improbability of returning to the lofty 19% affordability of 2019, a moment in time that set the base for the current iced market.
It’d take 2.2% mortgage rates, 70% pay raises, or 42% lower prices.
Without dramatic change, homebuying will remain a distant dream for most folks for years to come.
Jonathan Lansner is the business columnist for the Southern California News Group. He can be reached at jlansner@scng.com