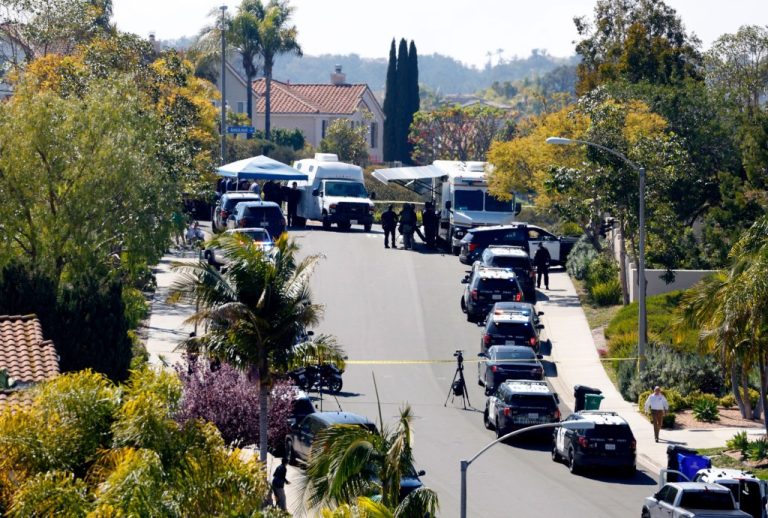
San Diego County saw a nearly 9% decrease in acreage with “very high” fire hazard compared to 2011, Cal Fire reported this week in a release of new maps for areas under local and county fire agency jurisdiction.
According to Cal Fire data, San Diego County has 157,338 acres with “very high” fire hazard, the highest level of hazard. In 2011, that figure was more than 180,700 acres.
The new maps released Monday also included two lower hazard designations — high and moderate — for the first time. San Diego County’s local jurisdictions accounted for more than 335,000 additional acres in those zones.

The maps detail fire hazard levels across Southern California for areas where city and county fire departments are responsible for responding to incidents, the first new maps of their kind in 14 years.
The release of the Southern California maps marks the end of a multi-day rollout of updated maps for the entire state.
While San Diego County saw a decrease in acres under the highest severity rating, areas including Los Angeles County, still reeling from the Eaton and Palisades fires, saw increases of 30%.
Statewide, more than 1 million acres under local jurisdiction are under the “very high” hazard rating, an increase from more than 860,000. More than 3 million acres were found to be in the new classifications across California.
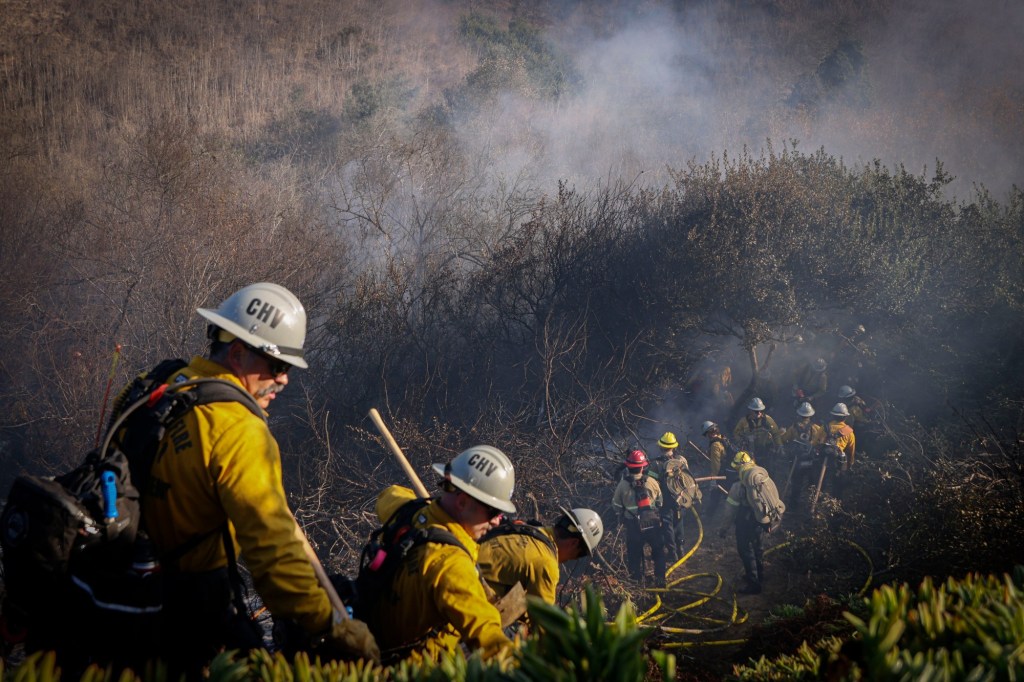
The agency studied a range of factors to draw its maps, including types of vegetation, slope, climate and fire history.
Much of the decrease was seen in the city of San Diego, whose area with “very high” fire hazard fell by nearly 30,000 acres.
But other cities saw sharp increases in acreage with the highest fire hazard.
Carlsbad saw its acreage jump from 4,840 in 2011 to 8,170. Chula Vista saw an increase from 3,717 acres to 8,939 acres.
The latest maps don’t provide updates to fire hazard levels for land under state responsibility. Those maps were updated last April, showing more than 16 million acres of the state with “very high” fire hazard.
Cal Fire noted that the maps detail an area’s susceptibility to wildfire, not risk.
“What we’re mapping is the hazard of the wildfire, which is the probability and the intensity of wildfire,” said Cal Fire Capt. Jim McDougald. “We’re saying that compared to the three zones, it’s got the highest probability that you have a fire that has the highest intensity.”
“Risk is the impact from that hazard,” he added.
The main uses for the maps, McDougald said, are for planning purposes for new homes.
“If you were to build a new home in the very high fire hazard severity zone, you would be required to build your house to Chapter 7A, which is the building standard,” McDougald said.
Builders would also have to follow more stringent standards regarding water supply, road widths, and ingress and egress paths.
Certain disclosures regarding the fire hazard must also be made in the event a home is sold and bought.
Communities have five months to comment on the maps before they are finalized and adopted locally.
But the maps can also help residents in hazard zones identify if their homes need to be hardened against fires.
“If you live in a hazard zone you always want to be taking steps to harden your property,” McDougald said, “doing defensible space, or retrofitting your home to harden it from embers or direct flame.”
McDougald noted that the changes in acreage, whether an increase or decrease, are due to multiple factors, including development and climate.
“When there’s new development that expands out, some of those areas may not be in very high (hazard) anymore because the vegetation is gone,” McDougald said.
“And we’re using a localized weather model now that’s looking at the weather from stations within the county,” he said.
The more localized data has helped identify more accurate wind speeds and locations.
“We’ve seen, in general, across the state that the hazard has gone up, and that’s really due mostly to that weather model,” he said.